The evolution of library analytics has come a long way, especially in the past few years. With legislation in privacy regulations, shifts to cloud-based data storage, the expansion of remote learning, and digital access taking priority due to COVID, libraries are looking to stay ahead and scale their library data to keep up with evolving trends.
In late 2021, EBSCO launched a survey with Library Journal to better understand the role of library analytics and challenges that stand in the way to successfully implementing, maintaining and scaling the right library analytics strategy. We surveyed almost 200 academic libraries in the US and Canada and found some interesting responses and trends.
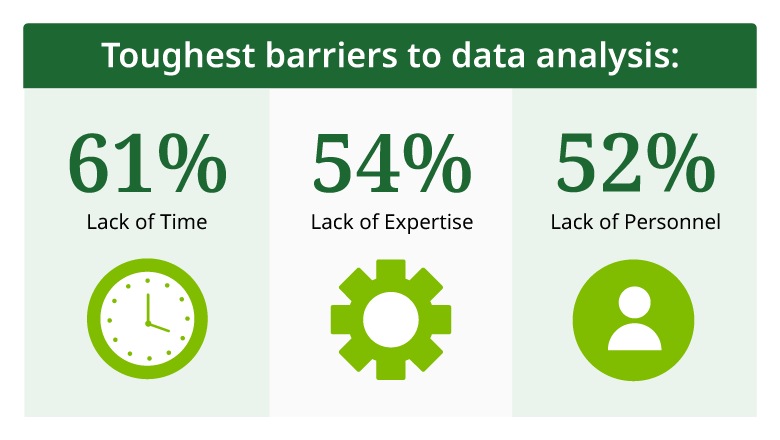
The Biggest Barriers – Time, Personnel and Lack of Expertise
When it comes to data collection and data analysis, many libraries shared their top barriers included lack of time, personnel and expertise. More than half of libraries named three barriers to data analysis at their institution to be lack of time (61 percent), lack of expertise (54 percent), and lack of personnel (52 percent). This trend may come as no surprise as many academic libraries in North America have been faced with reduced or flat budgets as a result of COVID-19.
Siloed “Dirty” Data > Harvesting Data
While gathering data is still a time-consuming task, larger schools with an enrollment 10,000 or more face greater difficulties with cleaning the data. For this cohort, siloed data is a larger obstacle than harvesting data. While libraries can connect their data into other areas of academic life (such as learning analytics and facility usage), their ability to streamline and scale data into their systems and workflows can be problematic. Some libraries still rely on manual processes for storing, gathering, and cleaning data.
This is where cloud-technology and in particular, technology built on a data lake and data warehouse infrastructures, can improve analysis. A data lake allows you to store non-relational data from various systems. Think of it as a body of water where hosted data is mixed and “floating” with no real order to it. This data then flows to a data warehouse where it is tidied up and accessed. Since the data lake and warehouse are built upon cloud services like Amazon Web Service (AWS) and Snowflake, it eliminates the need for administration duties. Steps such as hosting, extraction, organization, error and duplication review can be automated.
Not Enough of the Right Tools on the Market
While data management tools are widely believed to be available in the marketplace, 58 percent of respondents believe there are not enough tools available at their library (a considerably higher percentage of administrators — 73 percent –– shares this belief). The reason? Most tools only work with “traditional” library data. Librarians need a clear picture of the library’s landscape across collections, services and operations and there are few tools that can provide more advanced metrics with greater context. Additional data reporting also needs to be incorporated including gate counts, Wi-Fi usage, building service point usage and usage of co-located services (writing center, tutoring, computer lab, etc.). Furthermore, many support staff members note that while the requisite tools are available, they require in-depth learning and specific expertise. This means the “right” library analytics tool needs to cover a breadth of data, but also be a self-service platform for librarians to quickly access, view and dive into their data analysis –– with little need for training or “analytics expertise”.
When it comes to data collection and data analysis, many libraries shared their top barriers included lack of time, personnel and expertise.
When it comes to data collection and data analysis, many libraries shared their top barriers included lack of time, personnel and expertise.
Student Success Metrics Are Difficult to Obtain
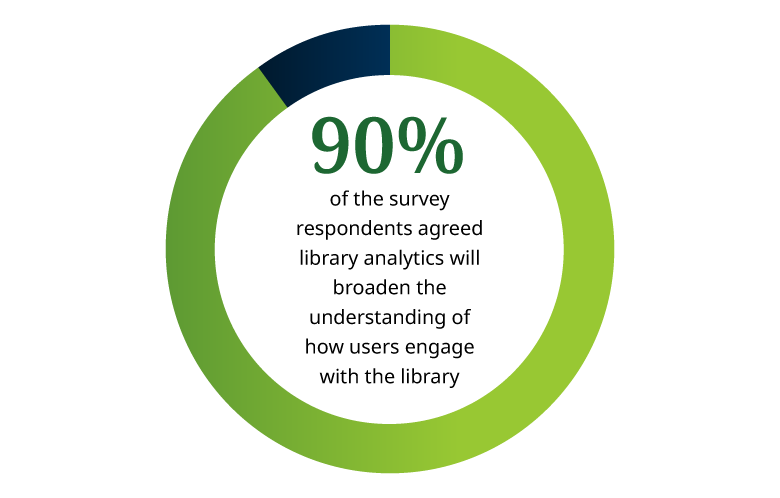
More than 90 percent of the survey respondents agreed (with 60 percent “strongly” agreeing) that library analytics will broaden the understanding of how users engage with the library.
Understanding engagement and influence on academic success is the key to success. The ACRL’s Assessment in Action program found five key areas where there is a positive correlation between library usage and influence and student success, these include: library instruction in initial coursework, general library usage, collaborative programs that include the library, information literacy instruction, and library research consultations. Of course, providing data to support these efforts is critical.
The Risk of Not Using Proper Analytics is Considerable
According to an ALA 2020 Survey, more than half of college and research libraries have seen reduction in areas of their budget, including planned hiring, professional development funding and collection development funding. This is echoed in our partnered survey. The majority of respondents stated that the risks of not using proper analytics are considerable:
- Eight out of ten believe the library will not be valued or considered by administrators.
- Nearly as many (78 percent) fear the correlations between engagement and user outcomes will be unclear.
- If assessment proves ineffective, 62 percent say that reductions in traditional library services could be the result.